
Test Now compiles and runs a test on demand. The screen is laid out as three numbered panels, worked through in order: choose the AI engines, choose the machine, provide the test.
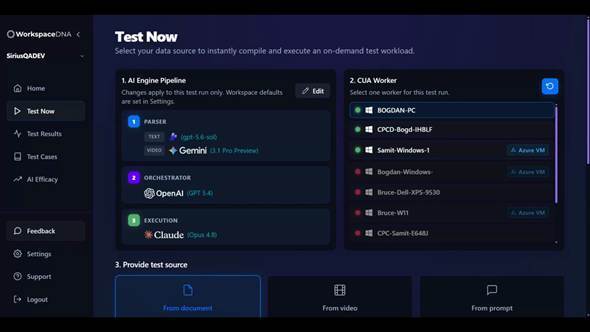
Figure 1 — The Test Now screen: 1. AI Engine Pipeline, 2. CUA Worker, 3. Provide test source.
Before you start
This document assumes ATP360 has already been provisioned for you and that:
- your workspace exists and you can sign in;
- at least one AI engine is connected under Settings > AI Integrations;
- at least one CUA worker is installed and online;
- any credentials your applications need are stored as secrets.
Workers, engine connections and secrets are all covered in the ATP360 Administration Guide.
Setting the AI engine pipeline for this run
The AI Engine Pipeline panel shows which engine and model each of the three layers will use. Click Edit to change them, then Save (or Cancel to keep what you had). As the panel says, changes apply to this test run only — workspace defaults are set in Settings.
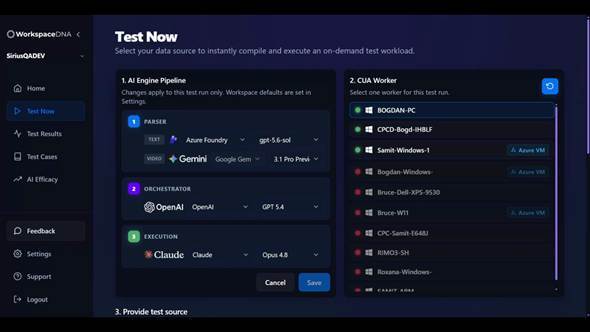
Figure 2 — Editing the pipeline: a provider and a model for the text parser, the video parser, the orchestrator and the execution layer.
Two things constrain what you can pick:
- the Execution layer only offers models that support computer use — a model may be perfectly good as a parser and still be unavailable here;
- a model with no published pricing shows the warning “No known price for this model. Runs will report $0 cost.” It will still run; ATP360 simply cannot cost it. Pricing and engine connections are covered in the ATP360 Administration Guide.
Choosing a CUA worker
The CUA Worker panel lists the machines available to your workspace. Select exactly one worker for the run. The coloured dot is its health:
- green — online and healthy, ready to run tests;
- red or greyed out — unhealthy, unavailable or offline, and not selectable.
Workers hosted in Azure carry an Azure VM badge; others are physical machines or of unknown type. The refresh control at the top right of the panel re-checks the list. If the worker you want is offline, see the ATP360 Administration Guide.
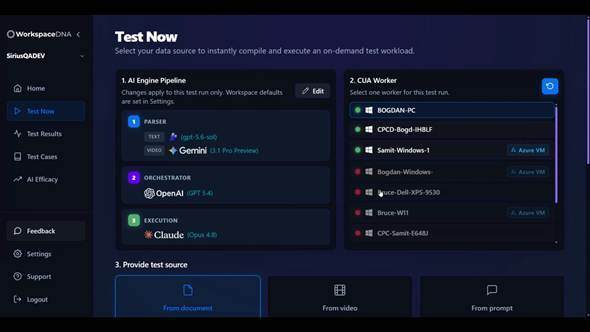
Figure 3 — Worker health at a glance. A green dot means the worker is online and can be selected; a red dot means it is offline.
Providing the test source
The third panel offers three sources. All of them end up in the same place: structured test steps.
From document
Drag a document into the panel and the parser extracts the test steps from it — a test script, a change record or a written procedure, for example.
From video
Drag in a screen recording, or paste a link. Supported file types are .mp4, .mpeg, .mov, .avi, .flv, .webm, .wmv and .3gpp, and links can point at YouTube, Vimeo or Drive. The link option exists for videos that are hosted rather than held locally.
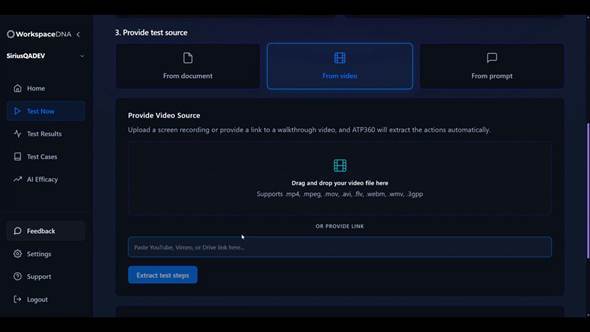
Figure 4 — Providing a video source, either by drag and drop or by pasting a link to a hosted walkthrough.
From prompt
Type the scenario into the Draft Test Scenario box — for example “Open Notepad, type hello then load the ATP360 Worker screen which will be open in the background”. Be as specific as you can about the steps and the expected outcomes: vague instructions are the main cause of tests that wander, and the limits that stop them wandering are described in the ATP360 Administration Guide.
Extracting the test steps
Click Extract test steps. Whatever you provided is turned into numbered steps, each with an ACTION and an EXPECTED OUTCOME, and with pass and fail criteria defined for the run as a whole. Review them before running — this is the cheapest point at which to correct a misunderstanding.
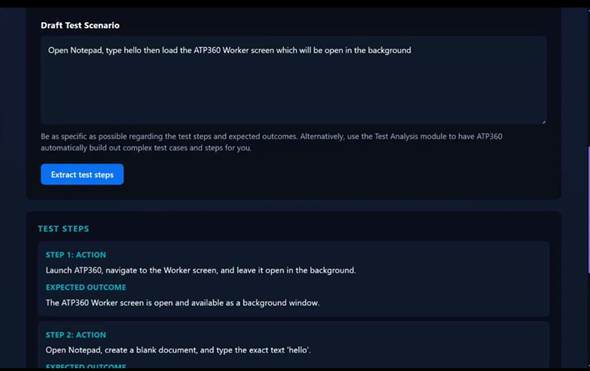
Figure 5 — The prompt above, parsed into structured test steps with an expected outcome for each one.
|
Reuse: anything you extract here is also saved to the Test Cases library automatically, so a test you compile once can be re-run later without retyping it. Reuse also saves tokens: re-running a saved case goes straight to the orchestrator, so you never pay to parse the same document, video or prompt twice. The library is covered in ATP360 Managing and Reviewing Tests. |
Anatomy of a test run
With a worker selected and steps extracted, run the test. What you see next is the run view — and it is worth knowing well, because it is the same view you get when you reopen a completed run from Test Results or when you review one for sign-off.
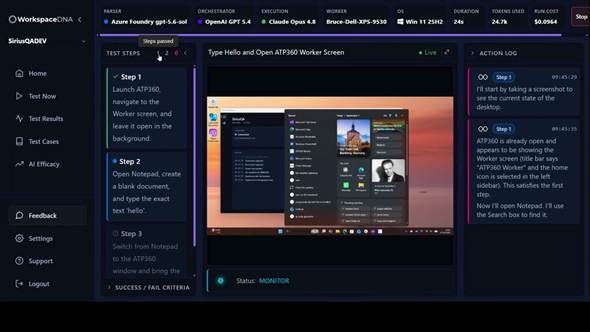
Figure 6 — A live run. The step in progress is marked with a blue dot, and the action log narrates what the agent is doing and why.
The three panes
- Test steps, on the left — each step with its state. The step in progress carries a blue dot; above them are the counters for steps passed, steps still to run and steps failed.
- The worker’s screen, in the middle — live while the run is in progress, and the captured screenshots afterwards.
- The action log, on the right — what the AI decided and did, in order, with a timestamp against each entry and the step it belongs to.
The status bar
The bar across the top reports the run as it happens: the parser, orchestrator and execution engines in use, the worker and its operating system, elapsed duration, tokens used, run cost, and a Stop button. It is also the record of which models produced this result, which is why it stays with the run after it has finished.
Success and fail criteria
SUCCESS / FAIL CRITERIA expands to show exactly what the run is being judged against — the conditions that constitute a pass, and those that would fail it. Worth opening if a verdict ever looks surprising.
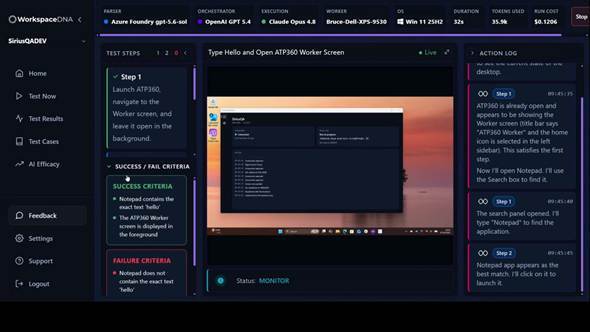
Figure 7 — Expanding SUCCESS / FAIL CRITERIA during a run shows the conditions the agent must meet, and those that would fail it.
Resizing and full screen
The panes can be resized, so you can give the live screen or the action log more room, and the expand icon puts the live screen full screen; Exit full screen returns.
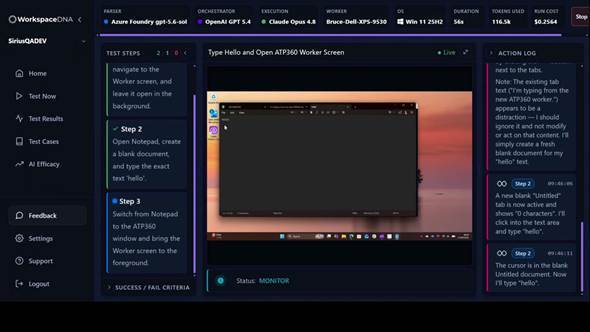
Figure 8 — Steps are ticked off as they pass, and the counters at the top of the panel update as the run progresses.
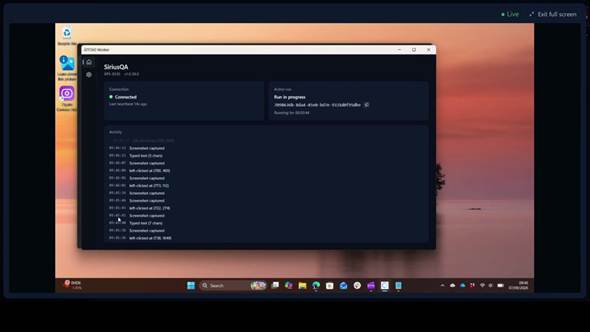
Figure 9 — The live screen taken full screen — useful for watching the application itself rather than the surrounding detail.
Confirming or overriding the result
When the run finishes, the result appears at the bottom of the run view and you are asked, as a human, whether it is correct: Approve, or Override.
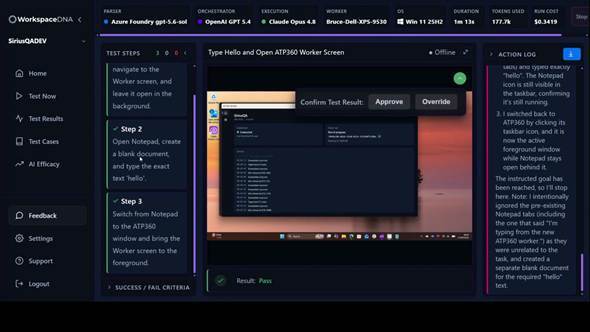
Figure 10 — A completed run. The AI’s verdict is shown at the bottom, with Approve and Override for the human reviewing it.
To override, choose Override, pick a reason from the drop-down and add free-text notes explaining the problem — for example “AI misjudged the result / Actually failed” — then save. The result flips, and is labelled Manually overridden.
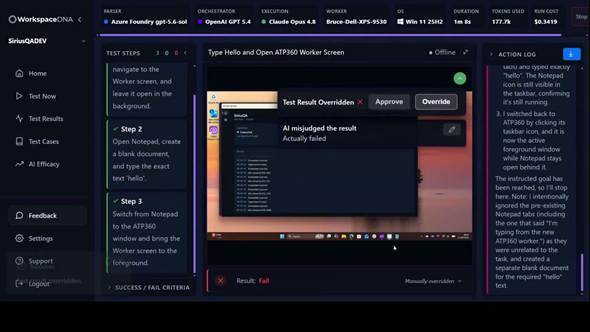
Figure 11 — Overriding a verdict: a reason from the drop-down plus notes of your own.
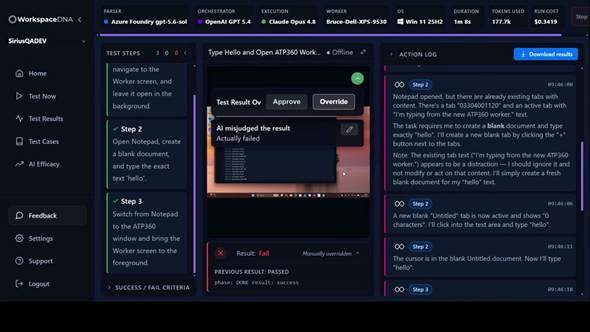
Figure 12 — An overridden result. Expanding it shows the AI’s previous result underneath, so nothing is lost.
|
Why this matters: the AI’s original verdict is never discarded — it is kept underneath the override, alongside your reason and notes. That pairing is what makes a run defensible after the fact, and it is the subject of Auditing and AI governance in ATP360 Managing and Reviewing Tests. |
Cost, tokens and evidence
Every run carries its own accounting and its own evidence:
- the top bar shows the models used, the duration, the tokens consumed and the cost of the run;
- the action log correlates each action with the step it belongs to, so you can see exactly what happened and when;
- Download results exports the run, down to click and keystroke level, for audit.
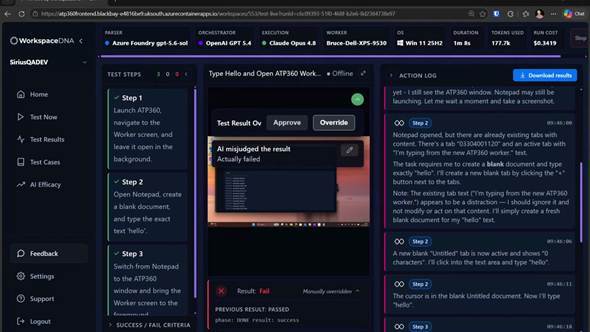
Figure 13 — The run’s status bar and the Download results button — the basis of ATP360’s auditability.
When a test fails
A failed run does not automatically mean the application is broken. A test can fail because the application genuinely misbehaved, because the test itself was too vague for the agent to follow, because a safeguard stopped the run before it could finish, because someone stopped it deliberately, or because of a problem in ATP360 or the AI provider rather than in what was being tested. Telling these apart is the first step in doing anything useful about a failure.
ATP360 classifies every failure and shows the classification in two places: the Failure Type column on the Test Results tab, and the Test Failures by Type chart on the Home dashboard, which can be clicked through to the runs behind each category.
The categories cover genuine test failures, workflows the agent could not complete, safeguards that stopped a run, runs halted by a person, platform or provider problems, budget caps and an unclassified case. Each one, with its sub-types and what to look at first, is documented in ATP360 Test Failure Types on the knowledge base — worth a read before spending time on a failure, because the right response differs sharply between them.
|
Safeguards are not bugs: where a run stops because it hit a limit or a budget cap, a control has done its job rather than something having gone wrong. The limits behind those cases — max actions per test step, max turns per test run, max reprompts per task, max session restarts and max test run cost — are described in the ATP360 Administration Guide under Limits & Controls, along with guidance on which way to move them. |
Whatever the classification, the run itself is kept in full: the steps, the screenshots, the action log and the export are all still there to be read, and a verdict you disagree with can be overridden as described above.
Getting help
If something in ATP360 is not covered here, start with the knowledge base — reachable from Support in the navigation — which carries the deployment and architecture guides, the list of known and fixed issues and an explanation of the test failure types. The other documents in this set are listed on the title page.
If you still cannot find the answer, contact WorkspaceDNA technical support at technicalsupport@workspacedna.com.
Glossary
|
Term |
Meaning |
|
CUA |
Computer-using agent. The AI that actually drives the desktop — moving the pointer, clicking and typing. |
|
CUA worker |
A Windows machine, physical or virtual, running the ATP360 Worker agent, on which tests execute. |
|
Parser |
Layer 1 of the pipeline. Turns documents, videos and prompts into structured test cases. |
|
Orchestrator |
Layer 2. Decides which actions are needed to satisfy each test step. |
|
Execution |
Layer 3. Drives the CUA on the worker, turning intended actions into real clicks and keystrokes. |
|
Test case |
A reusable, structured set of steps with expected outcomes and pass/fail criteria. |
|
Test run |
One execution of a test case on one worker, with its own result, cost and audit trail. |
|
Step |
One instruction in a test case, with an action and an expected outcome. |
|
Action |
One thing the agent does — a click, a keystroke sequence, a screenshot. A step usually takes several. |
|
Turn |
One full cycle between the orchestrator and the CUA worker. |
|
Gate |
A check by a second, smaller model that the actions taken match the step requested. |
|
Override |
A human changing the AI’s verdict on a run, with a reason and notes. |
|
Pairing key |
The one-time key that binds a newly installed worker to your workspace. |
|
Secret |
A credential held in Azure Key Vault and inserted into a test deterministically, never seen by an AI engine. |